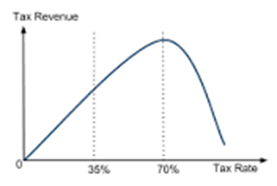
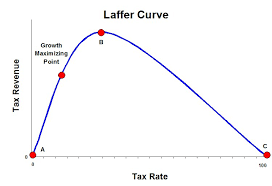
The Laffer Curve became popular in the 1980s as an argument for reducing tax rates.
The Laffer Curve, as shown below, is the illustration of the idea that it may be possible to increase tax revenue by reducing the tax rate. This concept is tantalising for politicians electorally popular tax cuts while not requiring the accompanying reduction in government receipts.
The view of the Laffer curve tends to be strongly influenced by political persuasion. A left-wing conceptualisation of the Laffer curve assumes that these effects only take effect at high taxation rates as shown in the left-hand chart in figure 1. A right-wing view of the Laffer curve shows that even relatively low rates of taxation can be reduced to increase tax revenue.
|
Figure 1: The Laffer Curve – two points of view
|
|
The Laffer Curve is often used to draw macroeconomic conclusions – to support statements such as “reducing taxes may actually increase revenue”. However, unless all taxes are assumed to be on the same activity, or completely unrelated to each other, there will be interplay between tax revenues from the various sources, which will in turn lead to a less smooth curve than that illustrated above, possibly featuring discontinuities, local solutions which differ from the global optimum will arise. In a Federal situation, where there may not be cooperation between the governments taxing, the situation will become akin to game theory – where a tax rate needs to be selected given other governments tax rates.
There are several important points about the Laffer curve:
- In essence, it is not an economic theory. It is an economic identity, which falls directly out of the maths. If we assume that tax revenue is zero if the amount of activity being taxed is zero and that at some sufficiently high level of taxation all taxpayers will be forced out of participation, tax revenue at that point will also be zero. Between these two points, there will be (at least) one rate of tax which is associated with the highest revenue. Any economic model with a tax that can be avoided can have a Laffer curve derived.
- The maximum point of the Laffer Curve is probably not as important as the slope. The government is unlikely to seek to maximise its revenue as its primary objective – even if it involves lower tax rates, there is considerable anecdotal evidence that there is a preference for lower government revenue as a proportion of GDP. This redefines the interpretation of the above curves as being the left-wing belief that collecting additional revenue will require significant increases in the tax rate, while right wing governments would tend to see that smaller increases in the tax rate will be sufficient to collect required revenue. (This is, in turn, assuming that the tax rate is operating on the left-hand side of the Laffer Curve, where the tax rate is lower for a given level of revenue, and minimising the distortion introduced into the economy associated with the tax.
- The tax rate, which is traditionally assumed to force revenue to zero at 100% may not do so. In the context of consumption taxes or similar -where the tax is added to the price, a 100% percent tax rate does not imply zero demand. Essentially, if a price is doubled by a tax, consumption will not necessarily stop. An income or profit tax levied at 100%, may not completely eliminate that activity.
- The Laffer curve does not make sense in the case of non-distortionary taxes – i.e. taxes which don’t change behaviour. A profit maximising firm will not change its output if the tax is a constant percentage of profit. Therefore, the tax rate which will maximise government revenue will be marginally below 100%. This is obviously of limited suitability as a policy prescription.
- The slope of the curve, which is asymmetric in both the left-wing and right-wing cases. If a policymaker, recognising the uncertainty surrounding any estimate of the Laffer curve, takes a probabilistic view of the Laffer curve, where the tax rate is chosen on the basis of maximising expected revenue, then some interesting results will ensue. A left-wing policy maker, recognising the potential for a rapid decrease in tax revenue if the tax rate is too high is likely select a tax rate which is below that which will maximise revenue – a move towards the right-wing policy makers preferred outcome. Similarly, a right-wing policy maker facing uncertainty is likely to select a higher tax rate given the risks associated with overshooting the optimal tax rate.
The Laffer Curve can be easily derived.
If we assume costless production, a tax of $t per unit a demand curve which relates price, p, to quantity sold, q, and parameters a and b in the form
Profit of the firm will be:
In order to maximise profit, the firm will differentiate the profit function, set the derivate to zero and solve for q, which we will denote q*.
This allows derivation of the Laffer curve, with R being government revenue:
Yielding the revenue maximising tax of:
Which has a relationship to the parameters of the demand curve, but no connection to the price of the good.
If we convert this to a percentage tax:
Which is a truly remarkable result. It says that if we have a linear demand curve and zero demand curves, the revenue-maximising tax rate is 66% of the product price.
While these assumptions are relatively strong, they are indicative of some interesting results which are hidden in the Laffer Curve.
It also indicates a relatively high rate of tax – which is more in line with the left wing view of the curve.
Further investigation to come…

